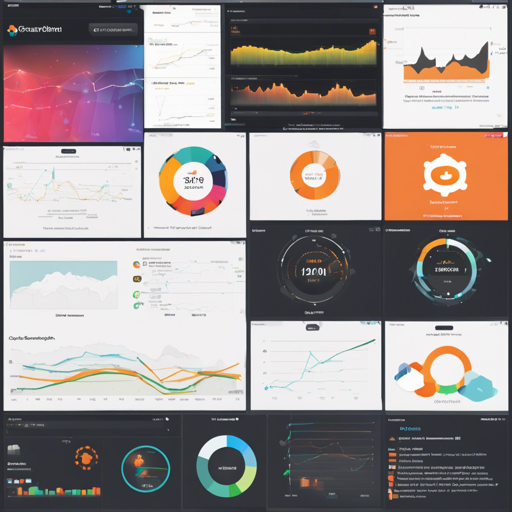
Welcome aboard the journey of visualizing your AWS CloudWatch metrics using the power of Grafana! This guide will help you set up stunning dashboards that empower you with valuable insights into your cloud resources. So, let’s dive into the sea of metrics and data!
Setting Up Your Grafana Dashboards
To get started with AWS CloudWatch dashboards in Grafana, follow these steps:
- Ensure you have access to Grafana. You can log in at localhost:3000.
- Make sure to configure your AWS credentials properly. You’ll need both access key and secret key.
- Import your desired AWS dashboards using the provided configuration script. This can be done all at once by executing a bash script.
- Set your dashboard variables such as Region appropriately after importing the dashboard.
Example Bash Script for Importing Dashboards
Here’s an analogy to explain the bash script for importing multiple dashboards. Imagine you are a chef preparing a multi-course meal. Every course requires different ingredients (dashboards) and the recipe (bash script) helps you gather them quickly to serve efficiently.
Below is the bash script you can use to fetch and import AWS dashboards:
#!/bin/bash
# Check if jq is installed, else abort
if ! jq --version > /dev/null; then
  echo "jq is not installed. Aborting."
  exit 1
fi

# Set Grafana and dashboard variables
grafana_host="http://localhost:3000"
grafana_cred="admin:admin"
grafana_folder="AWS CloudWatch"
ds=(1516 677 139 674 590 659)  # Add all necessary dashboard IDs here

# Fetching folder ID
folderId=$(curl -s -k -u $grafana_cred "$grafana_host/api/folders" | jq -r --arg grafana_folder "$grafana_folder" '.[] | select(.title==$grafana_folder).id')

if [ -z $folderId ]; then
  echo "Didn’t get folderId."
else
  echo "Got folderId: $folderId."
fi

# Importing each dashboard
for d in "${ds[@]}"; do
  echo -n "Processing $d: "
  j=$(curl -s -k -u $grafana_cred "$grafana_host/api/getdashboards/$d" | jq .json)
  payload="{\"dashboard\":$j,\"overwrite\":true"
  if [ ! -z $folderId ]; then
    payload="$payload,\"folderId\":$folderId"
  fi
  curl -s -k -u $grafana_cred -XPOST -H "Accept: application/json" -H "Content-Type: application/json" -d "$payload" "$grafana_host/api/dashboards/import"
  echo "done"
done
Troubleshooting Common Issues
As with most technical endeavors, you might run into a few bumps along the way. Here are some troubleshooting tips:
- If you encounter the error Unable to call AWS API or Metric request error, ensure you have set all dashboard variables correctly after import.
- Double-check your AWS credentials. Incorrect or incomplete IAM policies can also lead to access issues.
- If jq is not installed and you receive an error, make sure to install it using your system package manager.
For more insights, updates, or to collaborate on AI development projects, stay connected with fxis.ai.
Final Thoughts
At fxis.ai, we believe that such advancements are crucial for the future of AI, as they enable more comprehensive and effective solutions. Our team is continually exploring new methodologies to push the envelope in artificial intelligence, ensuring that our clients benefit from the latest technological innovations.
Happy monitoring with your new AWS CloudWatch dashboards on Grafana!

