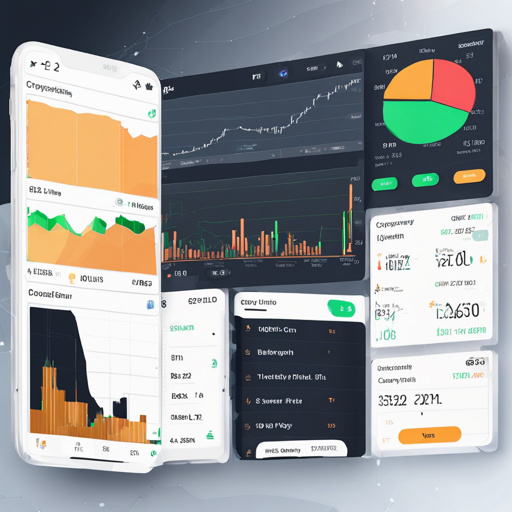
Are you interested in creating dynamic and interactive cryptocurrency charts? The TradingView API provides simple HTML snippets to create customizable charts and tickers for cryptocurrencies. Whether you’re a beginner or an experienced developer, this article will guide you step by step through the process of setting up your cryptocurrency dashboard.
Getting Started: Setting Up Your Environment
Before diving into the code, make sure to have the following:
- A basic understanding of HTML and JavaScript.
- Access to a web server or a local development environment to serve your HTML files.
Creating Your Dashboard
We’ll create various widgets for displaying cryptocurrency prices, including a candlestick chart, tickers, and more. Each section will require a specific piece of code. Here’s how to set up each type:
Candlestick Chart with Indicators
This chart shows price movements over time and includes technical indicators like RSI and Stochastic RSI, which can help with your trading decisions.
Crypto Currency Ticker
This widget displays a real-time ticker of cryptocurrency prices from different exchanges.
Mini Chart
A compact version that displays a mini chart for a selected cryptocurrency.
Understanding the Code: An Analogy
Think of the TradingView API like an artist’s toolkit for creating stunning paintings of cryptocurrency price movements. Each snippet of code represents different brushes and colors that can be used to create unique art pieces:
- Candlestick Charts: Like a detailed canvas where each candlestick represents a specific time frame’s open, high, low, and close values, allowing viewers to interpret price trends.
- Tickers: Think of them as the artist’s signature, constantly reminding the audience of the current prices in an eye-catching, scrolling format.
- Mini Charts: These are the small sketches that provide quick insights into price movements, perfect for a sneak peek without overwhelming detail.
Troubleshooting Common Issues
If you run into trouble while embedding your widgets, here are a few tips to consider:
- Widget not displaying: Ensure you’re using valid TradingView widget codes. Check for any typos in your key variables.
- JavaScript errors: Use the browser’s developer tools (F12) to check for any script errors that may prevent the widget from loading properly.
- Styling not appearing: Make sure that you define your dimensions and color themes correctly. A missing width or height can lead to layout issues.
- If further assistance is needed, stay connected with **fxis.ai** for more insights, updates, or to collaborate on AI development projects.
Conclusion
Creating a cryptocurrency dashboard using TradingView API is a straightforward process that allows you to visualize and interact with cryptocurrency data seamlessly. By utilizing the snippets covered, you can craft a customizable experience tailored to your needs.
At **fxis.ai**, we believe that such advancements are crucial for the future of AI, as they enable more comprehensive and effective solutions. Our team is continually exploring new methodologies to push the envelope in artificial intelligence, ensuring that our clients benefit from the latest technological innovations.

