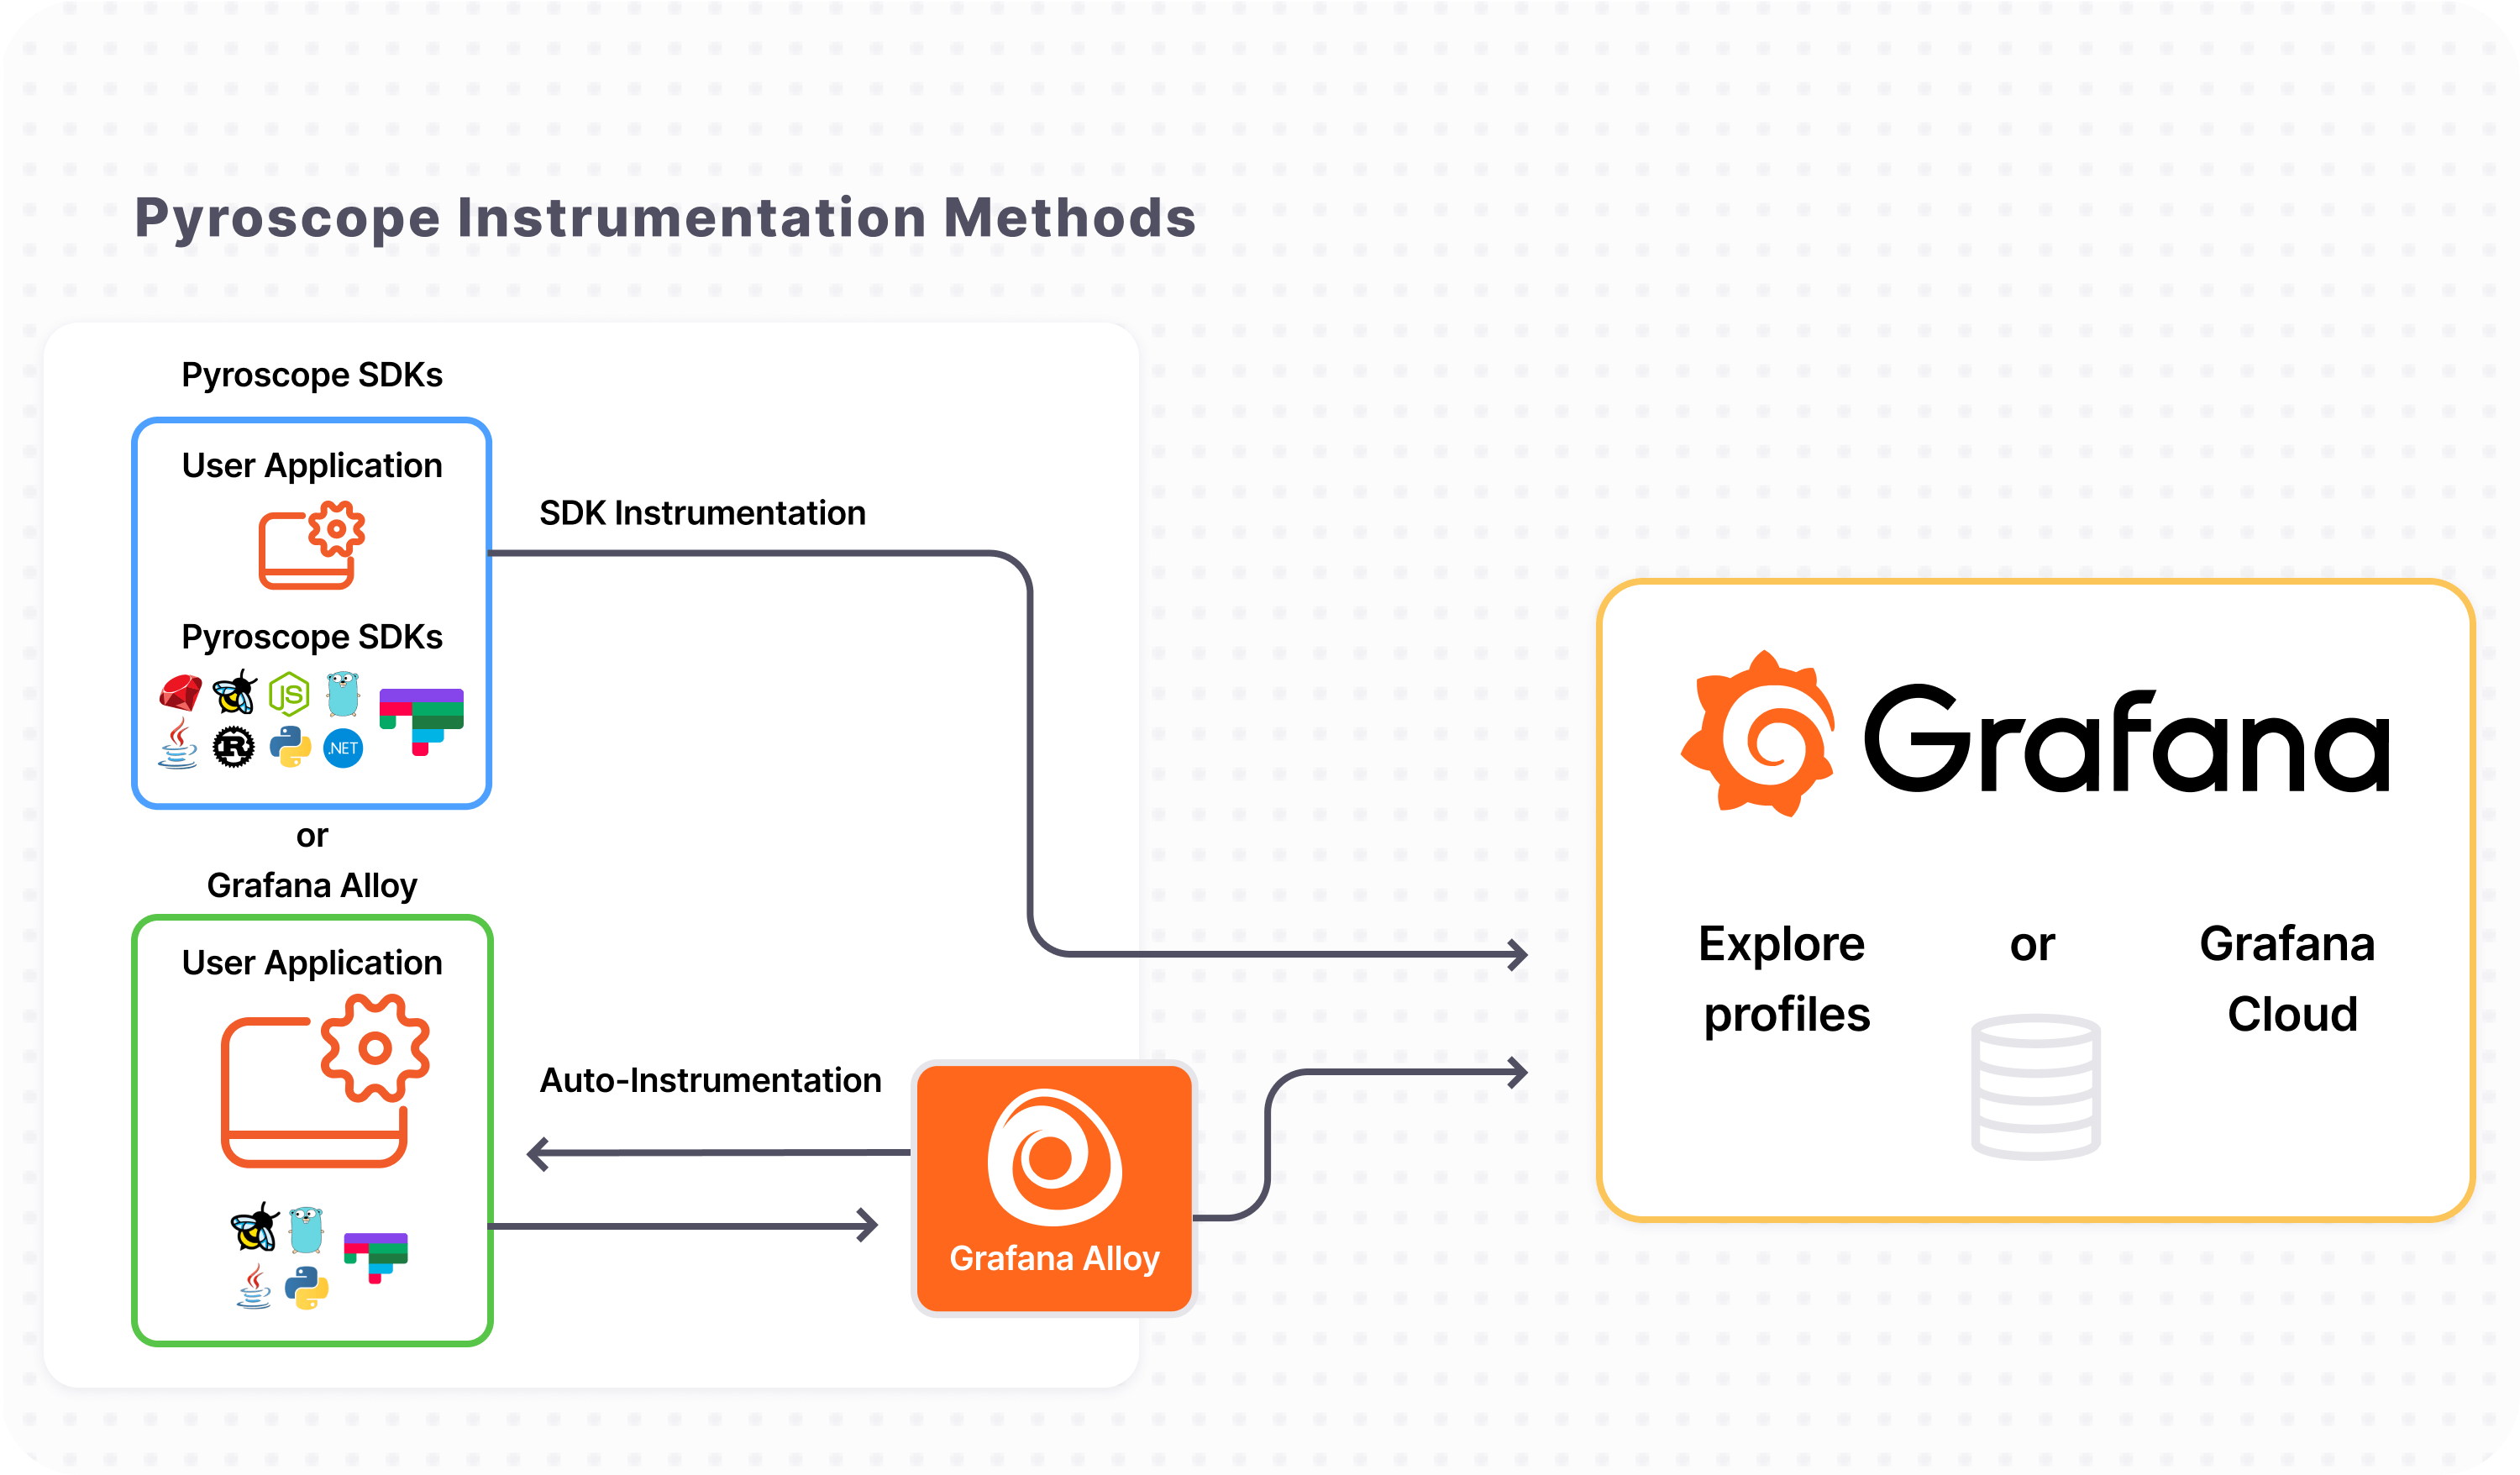
In today’s tech-savvy world, application performance is crucial for success. That’s where Grafana Pyroscope comes into play. With its powerful continuous profiling capabilities, Pyroscope helps you gain vital insights into application performance, allowing for optimization and troubleshooting. In this article, we’ll walk you through the steps to set up Grafana Pyroscope and get you on your way to optimizing your application’s performance.
What is Grafana Pyroscope?
Grafana Pyroscope is a continuous profiling platform designed to illuminate performance insights from your applications. It helps tackle both reactive and proactive performance challenges, optimizing resource usage including CPU, memory, and I/O operations. Think of it as a health check for your application, always alerting you of potential issues before they escalate.
How Does Pyroscope Work?

Pyroscope consists of three main components:
- Pyroscope Server: The heart that stores and processes profiling data.
- Pyroscope SDKs (push) or Grafana Alloy (pull): These collect profiling data from your applications and send it to the server.
- Explore Profiles UI: A user-friendly interface for visualizing and analyzing profiling data without having to write any queries.
Quick Start: Run Pyroscope Server Locally
To run the Pyroscope server, follow these easy steps:
Using Homebrew
brew install pyroscope-io
brew pyroscope
brew services start pyroscope
Using Docker
docker run -it -p 4040:4040 grafana/pyroscopeFor additional documentation on configuring the Pyroscope server, see the server documentation.
Quick Start: Run Explore Profiles UI in Grafana
To run the Explore Profiles UI, you have two main pathways:
- Grafana Cloud: Both the app UI and server are automatically installed and running—just start sending data!
- Grafana OSS: Install the plugin from the Grafana Plugin Directory to get started.
Troubleshooting Tips
If you encounter any issues during setup or configuration, here are some troubleshooting ideas:
- **Check your network configuration:** Ensure that your application can communicate with the Pyroscope server.
- **Consult the logs:** Review the server and client logs for any error messages that may provide insight into the problem.
- **Verify installations:** Make sure all components have been installed properly and are running as expected.
- **Explore our community resources:** For more insights, updates, or to collaborate on AI development projects, stay connected with fxis.ai.
Final Thoughts
Setting up Grafana Pyroscope is incredibly simple and opens the gateway to optimizing your applications effectively. Once you have it running, you’ll be able to proactively uncover performance bottlenecks and streamline resource usage.
At fxis.ai, we believe that such advancements are crucial for the future of AI, as they enable more comprehensive and effective solutions. Our team is continually exploring new methodologies to push the envelope in artificial intelligence, ensuring that our clients benefit from the latest technological innovations.

