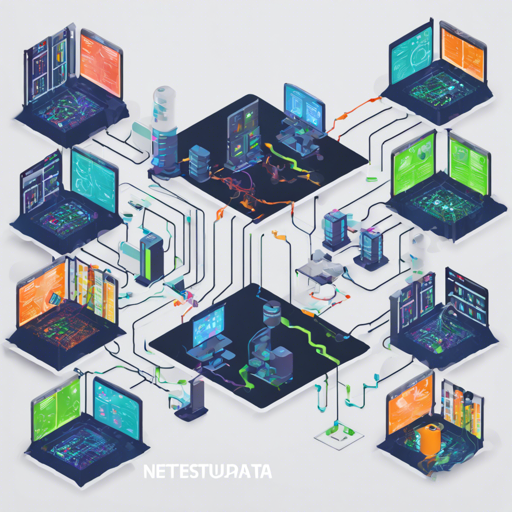
In today’s digital age, effective monitoring of servers, containers, and applications is vital. Enter Netdata – a robust observability platform that promises real-time, high-resolution monitoring with zero configuration hurdles. This guide will navigate you through the steps necessary to start using Netdata to keep your infrastructure in check.
Getting Started with Netdata
Monitoring your systems with Netdata can be broken down into five clear steps:
- Install Netdata Everywhere: Netdata can be installed across a multitude of platforms including Linux, macOS, FreeBSD, and even Docker. It takes just a line of code!
- Configure Collectors: Once installed, Netdata auto-detects most metrics, but some configurations are necessary to allow access to specific metrics.
- Set Up Alert Notifications: Netdata comes pre-loaded with alerts to notify you of issues, further customizable through various third-party integrations.
- Configure Netdata Parents: Parents aggregate data from child agents, offering a unified overview and enhanced retention policies.
- Connect to Netdata Cloud: Finally, the cloud service allows for management and access from anywhere, incorporating features like role-based access control and customizable dashboards.
Understanding the Netdata Ecosystem
The beauty of Netdata lies in its distributed architecture, akin to how a bustling marketplace operates. Here’s how it breaks down:
- Netdata Agent: This is the heart of your monitoring, collecting and storing metrics just like a vendor keeps track of their sales.
- Netdata Cloud: Think of this as the administrative office of the marketplace where all major decisions are made — it stores aggregated data, handles user management, and scales operations.
- Netdata UI: This is your customer service desk, where you visualize data through interactive dashboards, making the insights easy to access.
Troubleshooting Common Issues
As you embark on your Netdata journey, you might encounter a few hurdles. Here are some troubleshooting ideas:
- Installation Issues: Ensure you have the right dependencies installed. Check the package manager instructions for your operating system.
- Metric Not Detected: If certain metrics are not showing, revisit your collectors configuration.
- Performance Problems: If you notice high resource consumption, consider using Netdata Parents to offload processing tasks from your production systems.
For more insights, updates, or to collaborate on AI development projects, stay connected with fxis.ai.
Capturing the Essence of Netdata through Analogy
Think of monitoring your infrastructure like gardening. Just as a gardener needs to know if their plants are receiving enough water, sunlight, and nutrients, you need to ensure your servers and applications are performing healthily. Just as the gardener uses different tools to monitor their plants, Netdata provides various metrics and alerting systems to help you oversee the health of your infrastructure. Proper understanding and configuration ensure that your ‘garden’ is thriving while you eliminate the weeds (issues) before they overgrow.
Final Thoughts
At fxis.ai, we believe that such advancements are crucial for the future of AI, as they enable more comprehensive and effective solutions. Our team is continually exploring new methodologies to push the envelope in artificial intelligence, ensuring that our clients benefit from the latest technological innovations.
By following these steps and utilizing Netdata efficiently, you will transform the way you monitor your infrastructure, allowing for more transparent and actionable insights.

