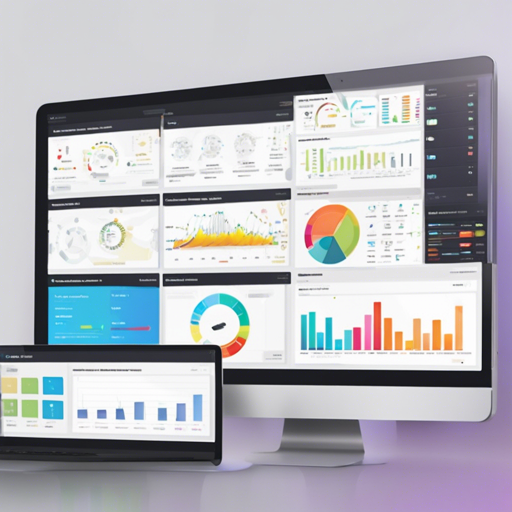
Welcome to your guide on using the Dashboard, a powerful utility designed to help you manage and visualize your experiment logs! Whether you’re a seasoned researcher or a curious developer, this easy-to-follow guide will walk you through the process of setting up and using the Dashboard to enhance your experiment management. Let’s dive in!
Getting Started
The Dashboard makes it possible to run experiments on a server and monitor the logs on your phone. Before we proceed, ensure you have the necessary environment ready and the Dashboard library installed. Once that’s done, you can start logging your experiment metrics with ease!
How to Report Experiment Metrics
The Dashboard provides a built-in reporting feature. Here’s a simple analogy to help you understand how this works:
Imagine you’re a teacher keeping track of student performance. Each student (representing an epoch in your experiments) has a number of tests (iterations). You note down their scores (metrics) each session, summarize them, and at the end of the class, you present the averages and clear your notebook for the next session. This is exactly how the Dashboard reporting works!
Here’s how to do it in code:
from dashboard import reporter
import numpy as np

r = reporter.Reporter()
for epoch in range(10):
    for i in range(5):
        metrics = {'loss': np.random.uniform(0, 1), 'f1': np.random.uniform(0, 1)}
        r.add(metrics)
    print(r.summary())  # prints loss: average loss, f1: average f1
    r.clear()
Using Writers
The Dashboard also supports various writers to send your logs to different outputs like a console, file, or even Firebase. Think of it as your notes going not just to your paper (file), but also being broadcasted to your friends (Firebase) in real-time.
Here’s how you can set this up:
from dashboard import writer
from time import sleep
import numpy as np
import random

random.seed()
console_writer = writer.ConsoleWriter()
file_writer = writer.FileWriter('foo.log')  # writes to foo.log

for epoch in range(3):
    for i in range(2):
        metrics = {'f1': np.random.uniform(0, 1), 'iteration': i, 'epoch': epoch}
        console_writer.add(metrics)
        file_writer.add(metrics)
        sleep(0.5)

exp1_hyperparams = {'d_hid': 100, 'dropout': 0.5, 'model': 'foo'}
exp2_hyperparams = {'d_hid': 200, 'dropout': 0.3, 'model': 'bar', 'comment': 'hello world!'}
writer1 = writer.FirebaseWriter('myexp1', exp1_hyperparams, delete_existing=True)
writer2 = writer.FirebaseWriter('myexp2', exp2_hyperparams, delete_existing=True)

for i in range(5):
    writer1.add({'iteration': i, 'score': random.uniform(0, 10)})
    writer2.add({'iteration': i, 'score': random.uniform(0, 10)})
    print('Wrote to firebase data from iteration {}'.format(i))
Configuring FirebaseWriter
To use FirebaseWriter effectively, you need to create a configuration file. It’s like giving a pass to your friend (the code) to access the exclusive club (Firebase).
Your config file (~.fb.config) should look like this:
{
  "email": "your_email@example.com",
  "password": "your_password",
  "secret": "some_secret",
  "apiKey": "your_firebase_api_key",
  "authDomain": "your_firebase_auth_domain",
  "databaseURL": "your_firebase_database_url",
  "storageBucket": "your_firebase_storage_bucket"
}
Using the Firebase Web Client
Once you have everything configured, you can create a web client to visualize your data. It’s essential to follow these steps to ensure the client can read and write to your database:
- Create an app on Firebase and locate your config.
- Enable email accounts and create an account/password for FirebaseWriter.
- Create your configuration file and include your Firebase credentials.
- Launch your web server.
Hosting Your Client
You can host static web pages on your machine or deploy your app on Firebase:
Hosting Locally
cd client/public
python -m http.server 9090
Visit localhost:9090 to see your dashboard!
Hosting on Firebase
Follow the steps outlined in the Firebase documentation to deploy your app properly.
Troubleshooting
If you encounter issues during setup or functionality, consider these troubleshooting ideas:
- Ensure that you’ve correctly followed all installation steps and have the necessary dependencies.
- Check your Firebase configuration details in the ~.fb.config file.
- Inspect the console for error messages; they often provide clues on what went wrong.
For more insights, updates, or to collaborate on AI development projects, stay connected with fxis.ai.
At fxis.ai, we believe that such advancements are crucial for the future of AI, as they enable more comprehensive and effective solutions. Our team is continually exploring new methodologies to push the envelope in artificial intelligence, ensuring that our clients benefit from the latest technological innovations.
Conclusion
The Dashboard offers a user-friendly way to log and visualize your experiments seamlessly. By following the steps outlined in this guide, you can harness the full potential of your data and elevate your research to new heights!

