
Welcome to the world of financial data visualization in Flutter! In this blog post, we will take a closer look at how to implement elegant OHLC (Open, High, Low, Close) candlestick and trade volume charts using the flutter_candlesticks package. Whether you are building a trading application or simply want to analyze stock trends, this guide will lead you through the process smoothly.
Installation Guide
First things first, you need to install the flutter_candlesticks package. To do this, simply add the following line to your pubspec.yaml file:
dependencies:
  flutter_candlesticks: ^latest_version
Then, run flutter pub get to install the package.
Understanding the Properties
The OHLCVGraph widget requires the following properties:
- data: A list of maps containing the open, high, low, close, and volume data (required).
- enableGridLines: Boolean to enable or disable grid lines (required).
- volumeProp: Proportion of the container to allocate to volume bars (required).
- lineWidth: The width of most lines (default is 1.0).
- gridLineAmount: Number of grid lines to draw (default is 5).
- gridLineWidth: Width of grid lines (default is 0.5).
- gridLineColor: Color of grid lines (default is Colors.grey).
- increaseColor: Color of increasing candles (default is Colors.green).
- decreaseColor: Color of decreasing candles (default is Colors.red).
Code Walkthrough: An Analogy
Let’s imagine building your candlestick chart is like decorating a garden. Each property you define acts as a different decorator finishing their task to create a beautiful display.
- data: This is your garden’s framework, the plants themselves. Each plant (or data point) has its unique attributes (open, high, low, close, volume). Without these, your garden won’t have any structure to build upon.
- enableGridLines: Think of this as adding decorative stones to guide visitors. If stones (grid lines) are enabled, they help structure the garden—a neat path to follow.
- lineWidth: This is the thickness of your plants’ stalks. If they are too thin, they might get lost among the weeds; if they are too thick, they may overpower the flowers.
- color properties: These are the colorful blooms you choose to plant. Whether you prefer vibrant greens for growth or reds for attention, the colors set the tone of your garden.
Example Implementations
Below are some examples to illustrate how to use the OHLCVGraph widget:
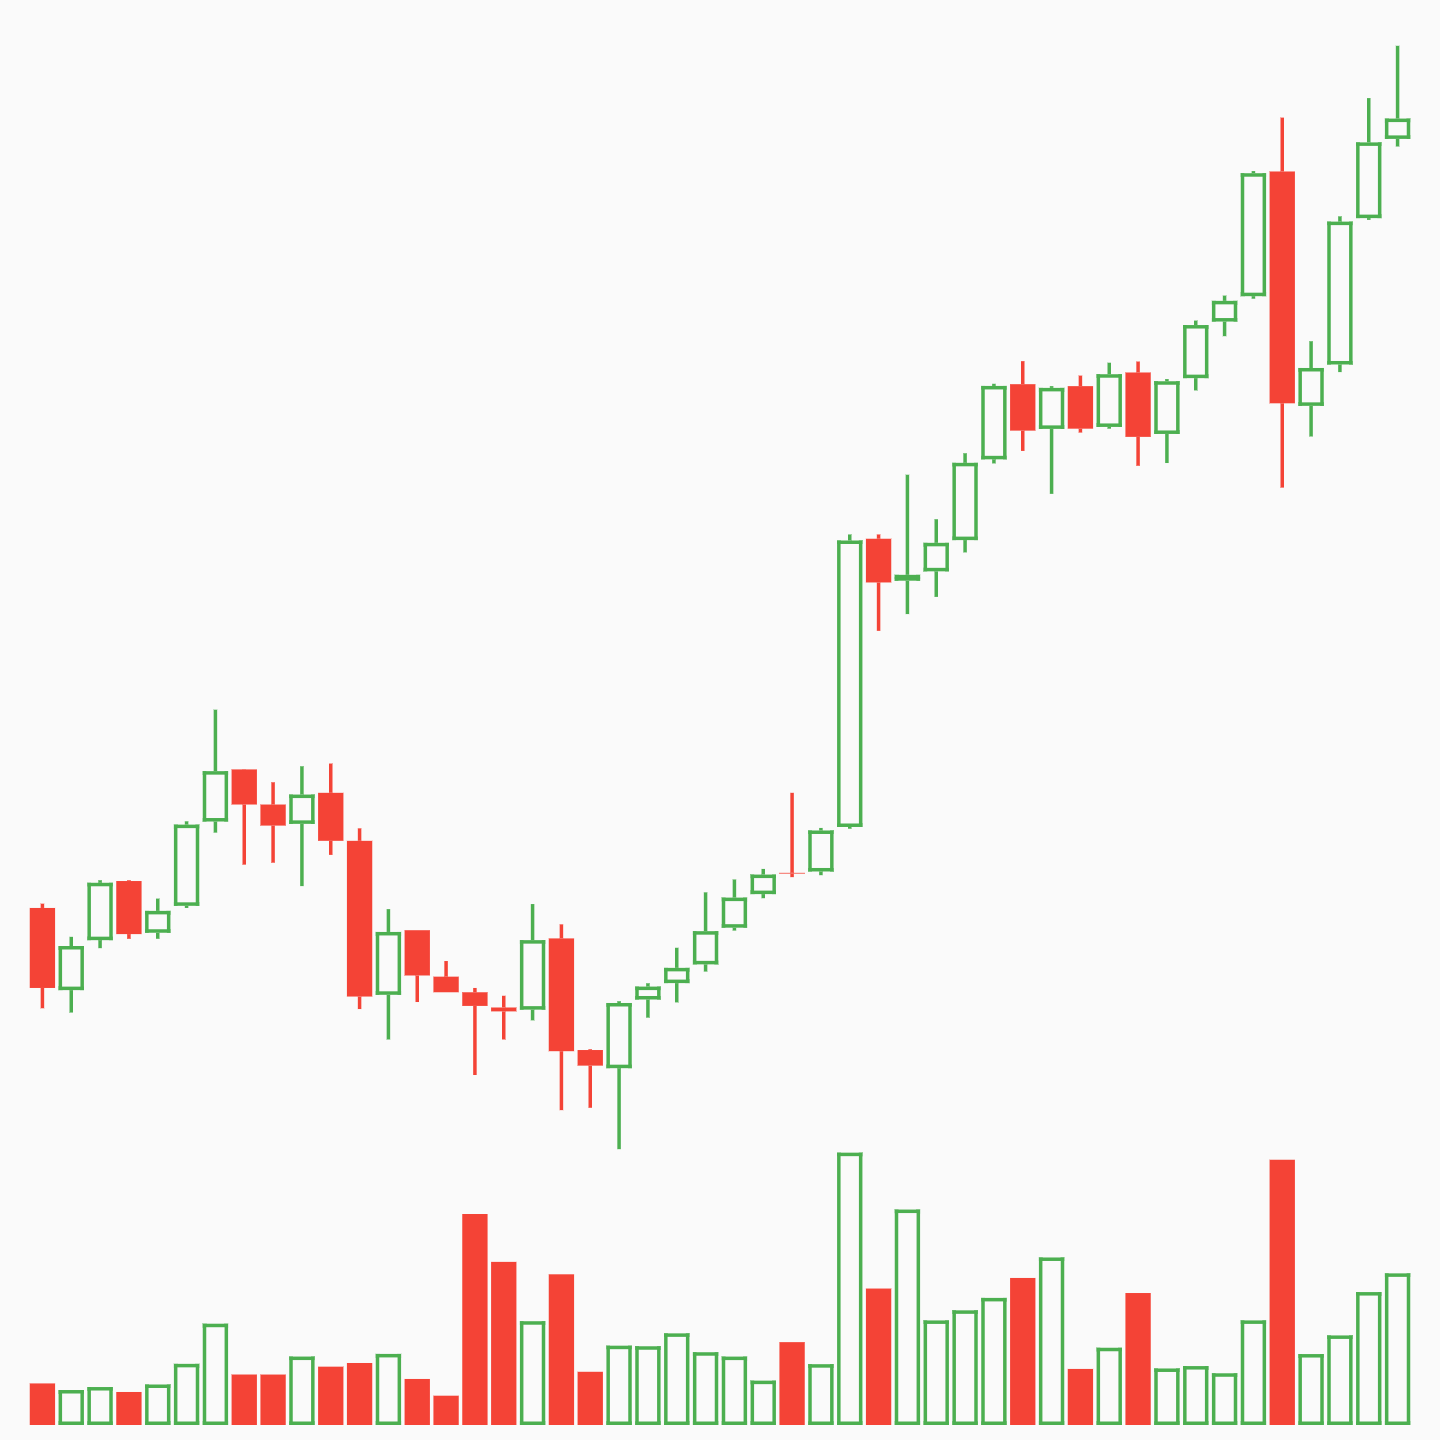
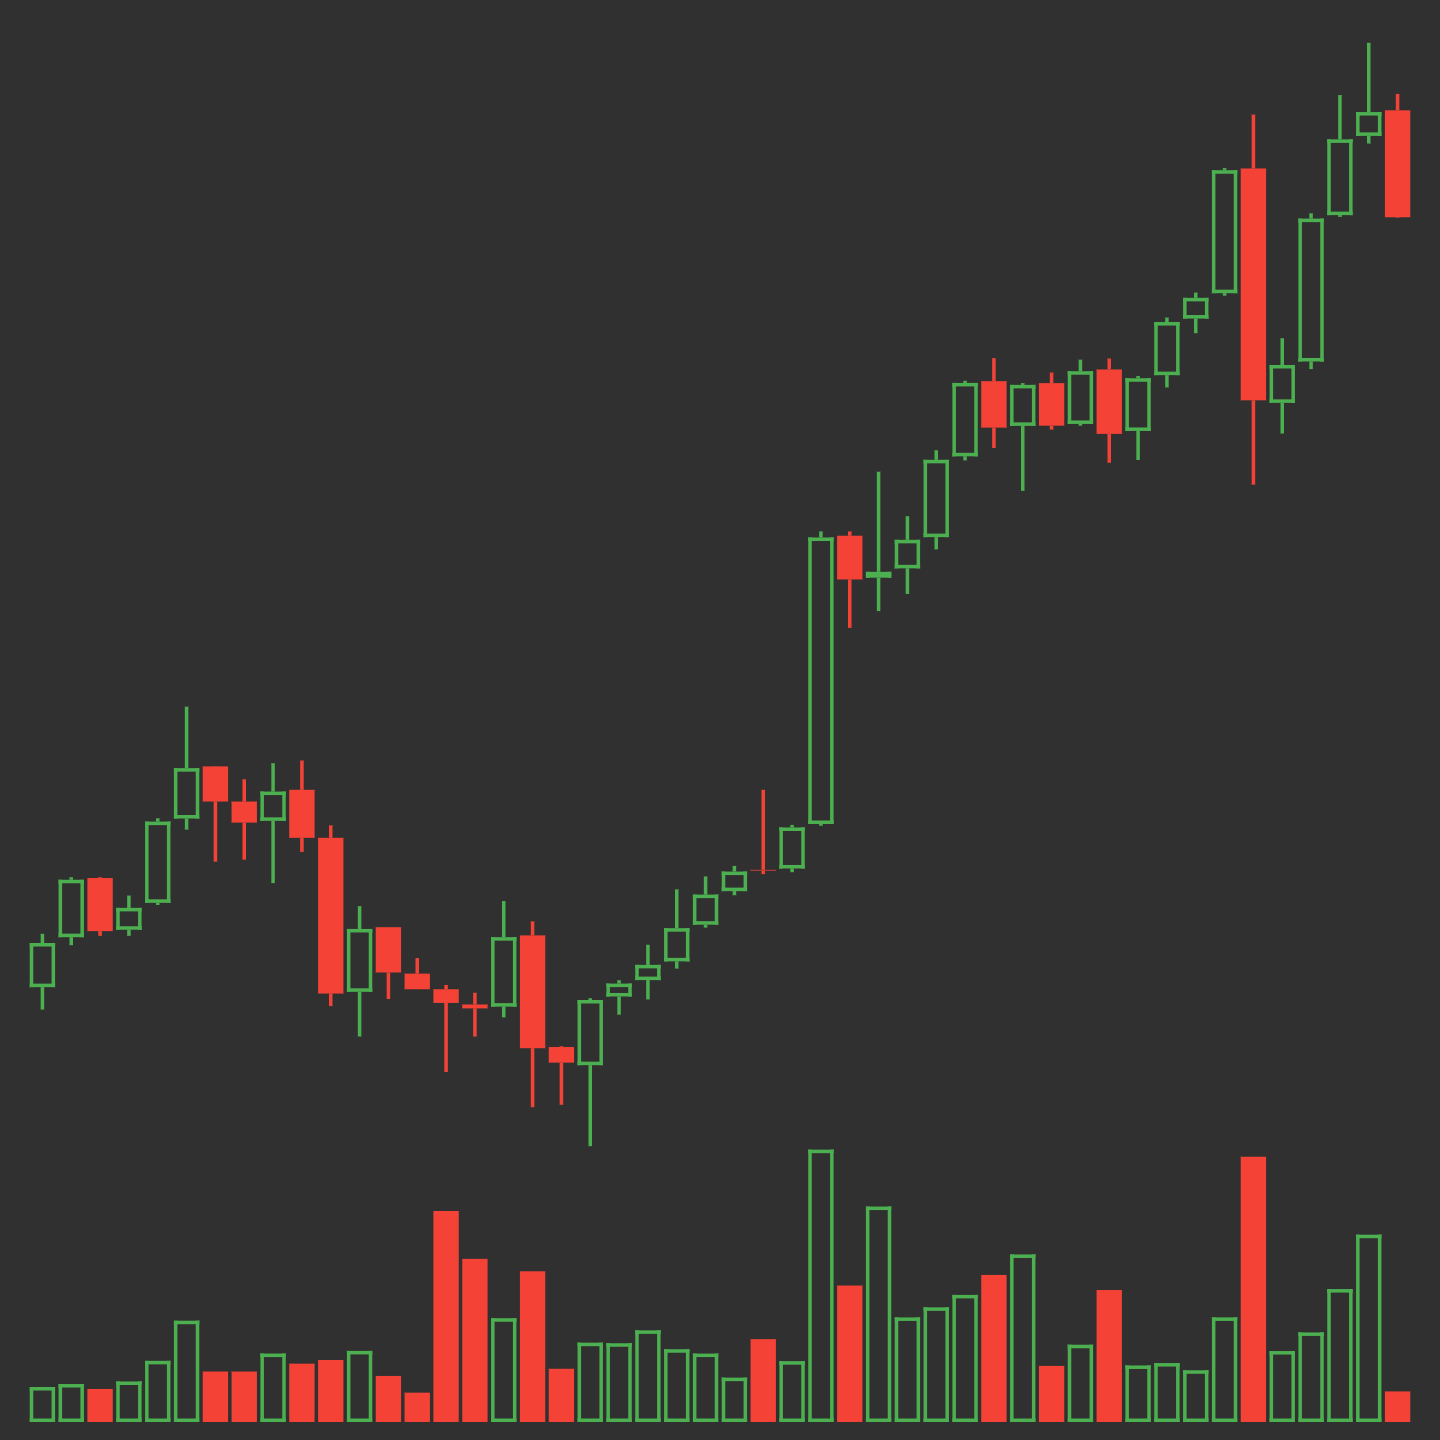
No Grid Lines
OHLCVGraph(
    data: sampleData,
    enableGridLines: false,
    volumeProp: 0.2
)
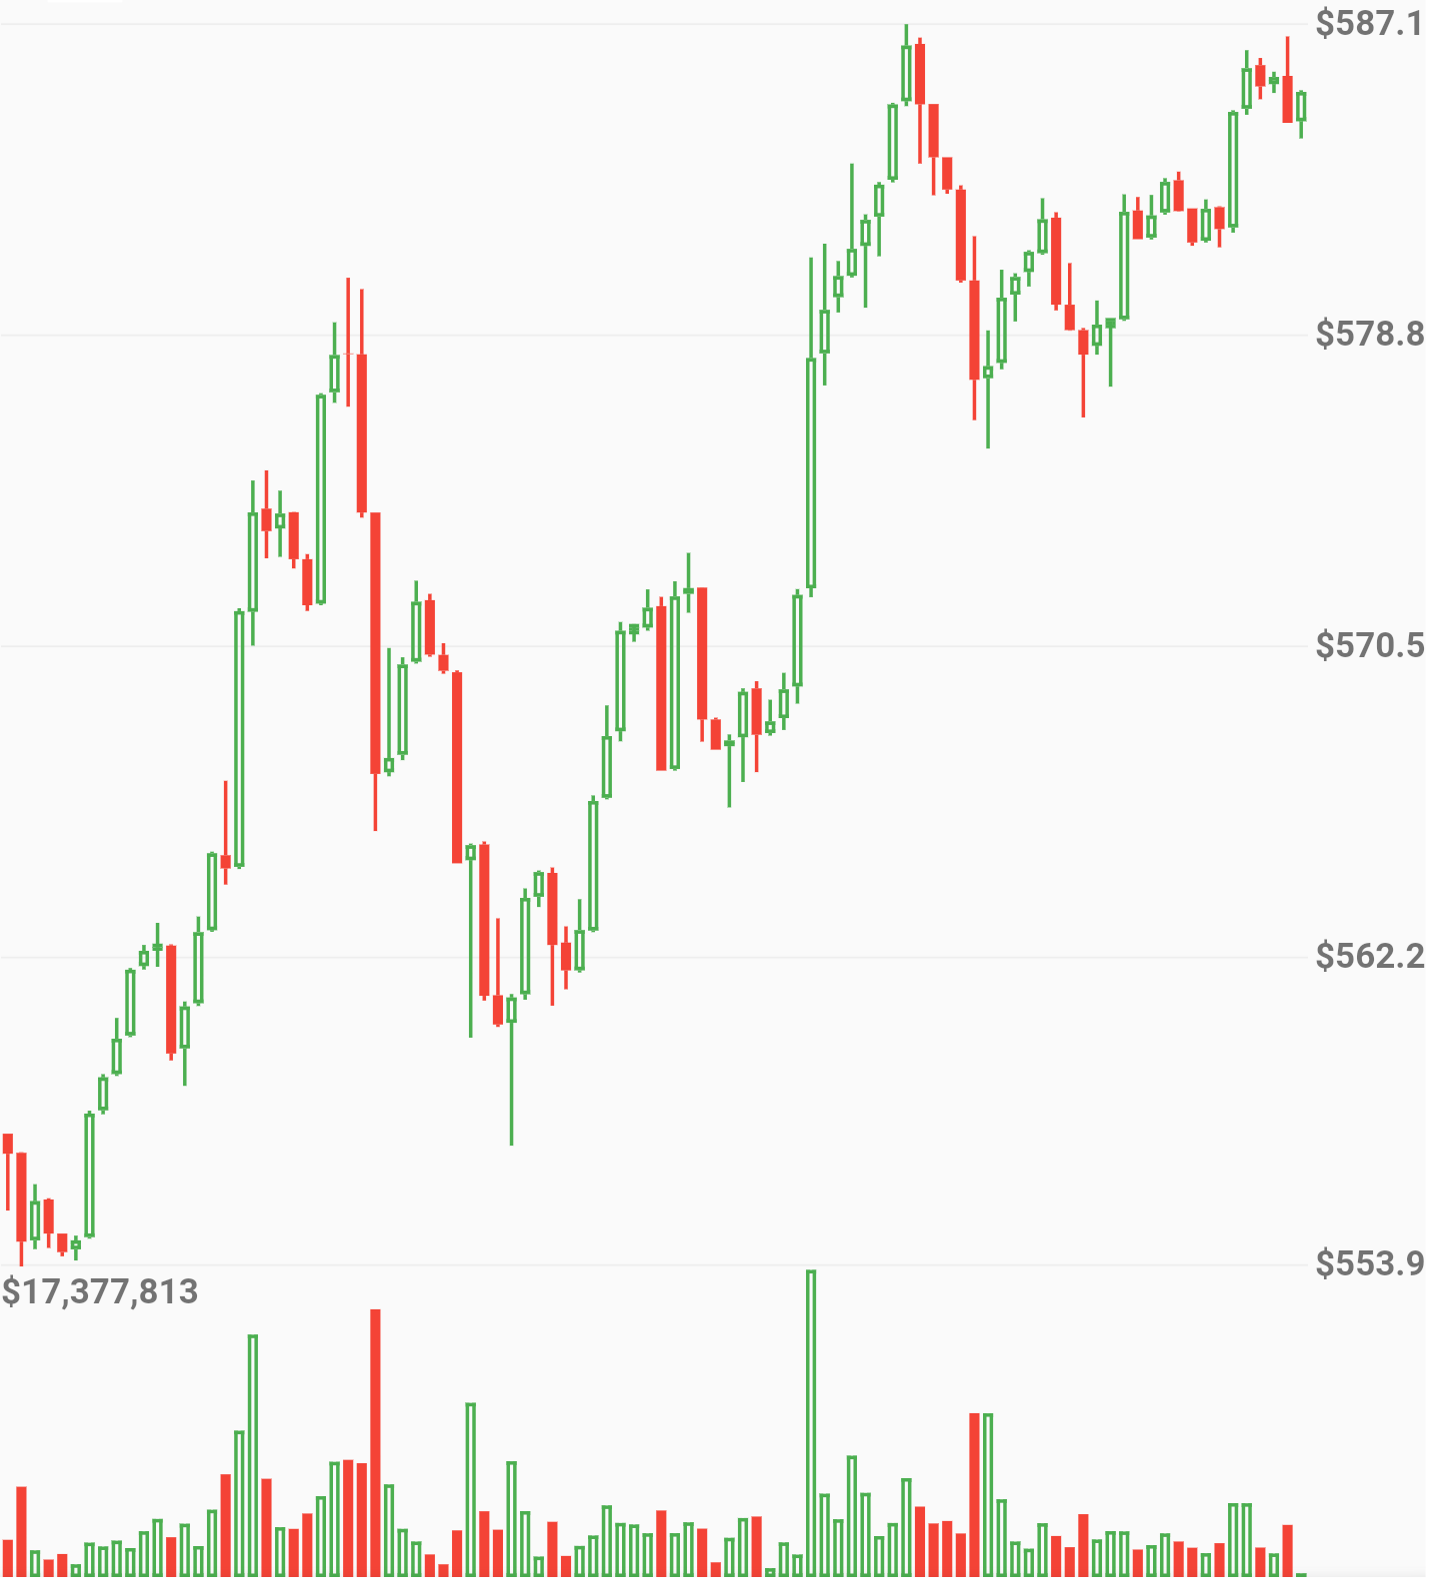
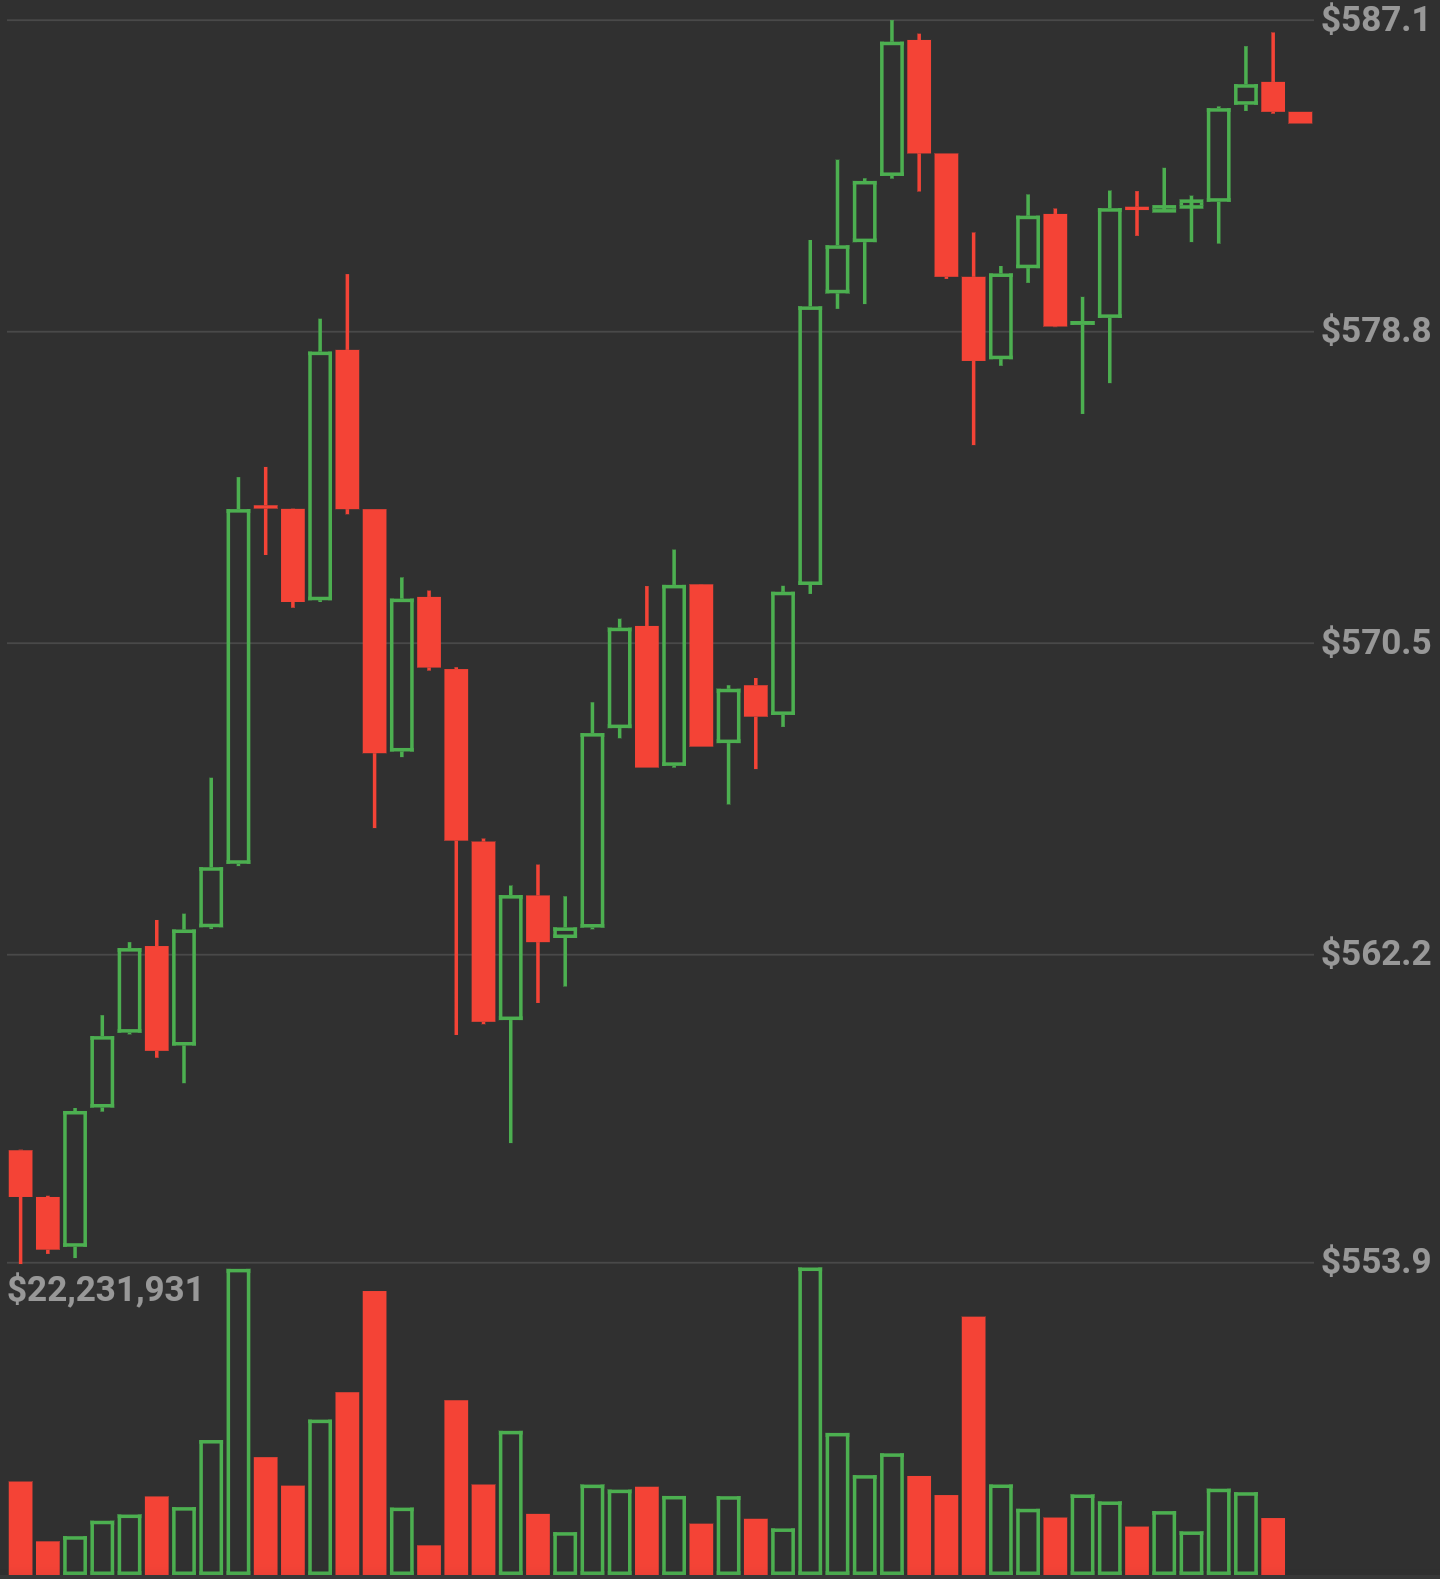
With Grid Lines
OHLCVGraph(
    data: sampleData,
    enableGridLines: true,
    volumeProp: 0.2,
    gridLineAmount: 5,
    gridLineColor: Colors.grey[300],
    gridLineLabelColor: Colors.grey
)
Full App Example
Here’s a complete example to get you started:
import 'package:flutter/material.dart';
import 'package:flutter_candlesticks/flutter_candlesticks.dart';

void main() {
  List sampleData = [
    {'open': 50.0, 'high': 100.0, 'low': 40.0, 'close': 80.0, 'volumeto': 5000.0},
    {'open': 80.0, 'high': 90.0, 'low': 55.0, 'close': 65.0, 'volumeto': 4000.0},
    {'open': 65.0, 'high': 120.0, 'low': 60.0, 'close': 90.0, 'volumeto': 7000.0},
    {'open': 90.0, 'high': 95.0, 'low': 85.0, 'close': 80.0, 'volumeto': 2000.0},
    {'open': 80.0, 'high': 85.0, 'low': 40.0, 'close': 50.0, 'volumeto': 3000.0},
  ];

  runApp(
    MaterialApp(
      home: Scaffold(
        body: Center(
          child: Container(
            height: 500.0,
            child: OHLCVGraph(
              data: sampleData,
              enableGridLines: false,
              volumeProp: 0.2
            ),
          ),
        ),
      ),
    ),
  );
}
Troubleshooting
Despite best efforts, issues may arise. Here are some troubleshooting tips:
- If your charts are not rendering, ensure that
pubspec.yamlis updated and you’ve runflutter pub get. - Check for any missing or incorrectly named properties in your data structure.
- If color properties aren’t displaying as expected, verify the color definitions in your code.
- For more insights, updates, or to collaborate on AI development projects, stay connected with fxis.ai.
Conclusion
Candlestick charts are invaluable for analyzing market trends. By utilizing the flutter_candlesticks package, you can effectively visualize and interpret financial data in your Flutter applications.
At fxis.ai, we believe that such advancements are crucial for the future of AI, as they enable more comprehensive and effective solutions. Our team is continually exploring new methodologies to push the envelope in artificial intelligence, ensuring that our clients benefit from the latest technological innovations.