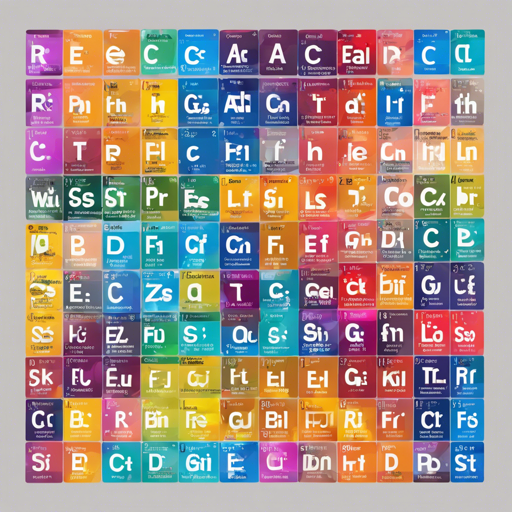
Welcome to the colorful world of the Periodic Table of Elements, crafted using CSS Grid and React! This blog will guide you through the process of running this project on your computer, and provide insights on how it was skillfully constructed.
How to Run It on Your Computer
To bring the periodic table to your local environment, follow these easy steps:
- Install Node.js: Ensure that Node.js is installed on your machine. Need help? Follow this tutorial to setup a local development environment with Node and Git bash.
- Clone the Repository: Open your terminal and run the following command:
git clone https://github.com/tamalchowdhury/periodic-table.gitcd periodic-tablenpm installnpm run devHow It Was Made?
The periodic table is more than just a collection of boxes; it’s a beautiful layout designed using CSS Grid! Think of CSS Grid as a tailored tool, like a grid of city blocks, where each element is a house in its designated location. The table comprises 18 columns, laid out in a whimsical arrangement that reflects the elements’ characteristics.
I utilized viewport width to ensure that the table scales nicely on different screen sizes. Each element is visually created by a div with a unique class, like element-1, where each class name corresponds to an element’s position in the table.
Utilizing Emmet helped automate the population of 118 boxes, while the distinct class names simplified their arrangement in the CSS. For the transition between Lanthanides and Actinoids, I cleverly pushed down the markup to create a smooth split.
After designing the layout, I transitioned to using React. This additional layer provided interactivity, making it possible to engage with each element. I discovered a handy JSON resource containing all the essential element information, which immensely streamlined the process, allowing for dynamic population of symbols and descriptions.
For a more detailed breakdown of the project, check out my comprehensive blog post: How I made The Periodic Table with CSS Grid and React.
Troubleshooting Ideas
If you encounter issues while running the periodic table, consider the following ideas:
- Ensure that Node.js is properly installed. You can verify this by running
node -vin your terminal. - Check for any error messages in your terminal during the installation or when running the project. They can often clue you into what might be going wrong.
- If the app does not load, double-check the localhost address to see if Vite has provided a different URL.
If these solutions don’t resolve your issue, feel free to reach out for assistance. For more insights, updates, or to collaborate on AI development projects, stay connected with fxis.ai.
At fxis.ai, we believe that such advancements are crucial for the future of AI, as they enable more comprehensive and effective solutions. Our team is continually exploring new methodologies to push the envelope in artificial intelligence, ensuring that our clients benefit from the latest technological innovations.

